Uncover Your Site Engagement
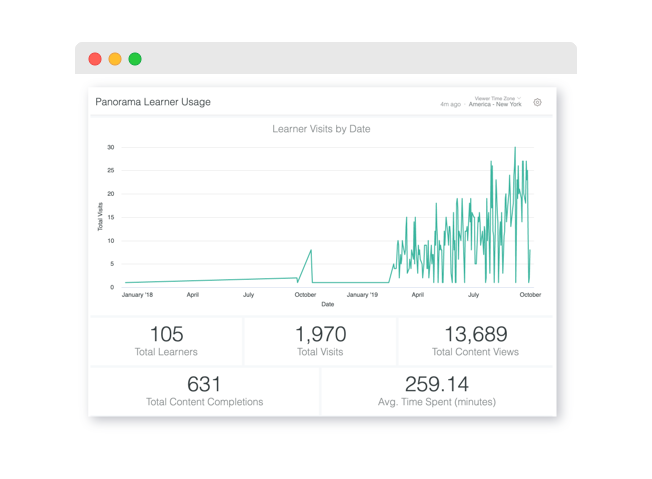
Monitor your learning site to pinpoint areas of strength and room for improvement. Get a clear understanding of your web traffic and content engagement.
- Enrolled Learners
- Site Visits
- Time per Visit
- Page Views Over Time


Understand your learning business impact with Thought Industries reporting hub.
Monitor your learning site to pinpoint areas of strength and room for improvement. Get a clear understanding of your web traffic and content engagement.


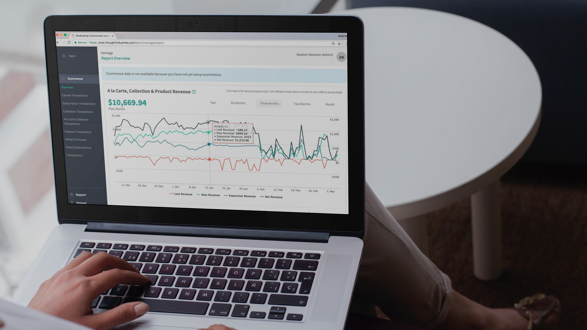
Identify metrics such as customer acquisition, conversion rates, average order value, and cart abandonment to discover potential within your learning initiative.
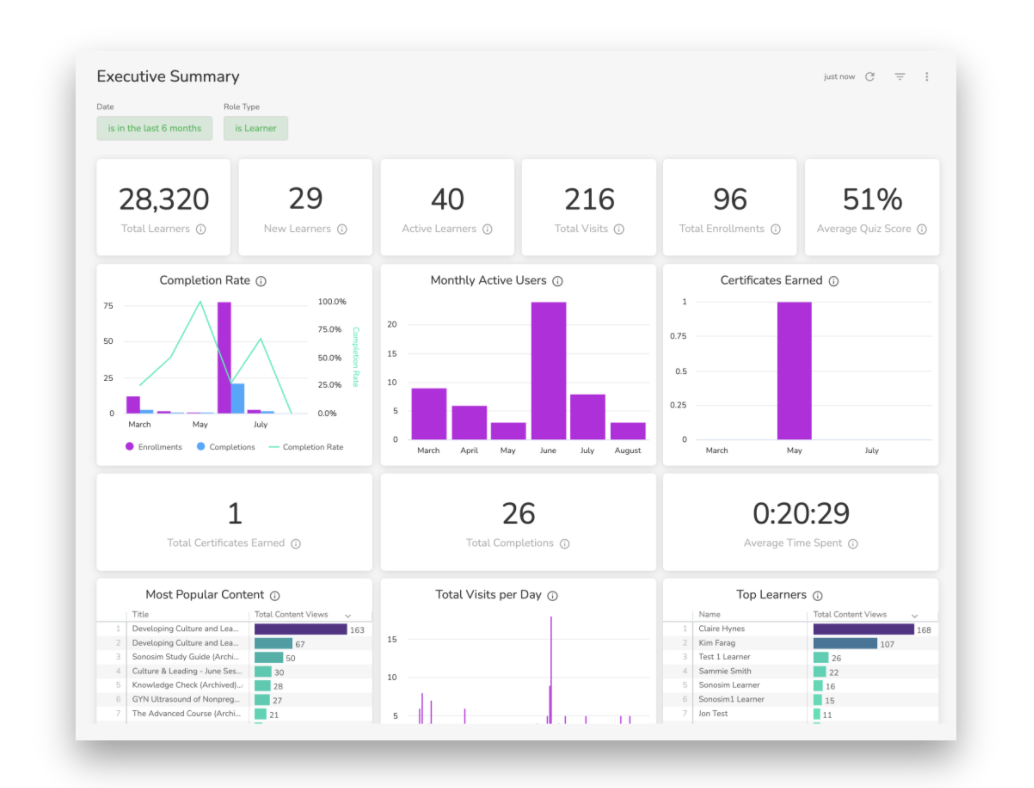
Go deep into your learning initiative for granular reporting by learner, content, course, or action. Reports are highly flexible and can be exported for more detailed analysis.


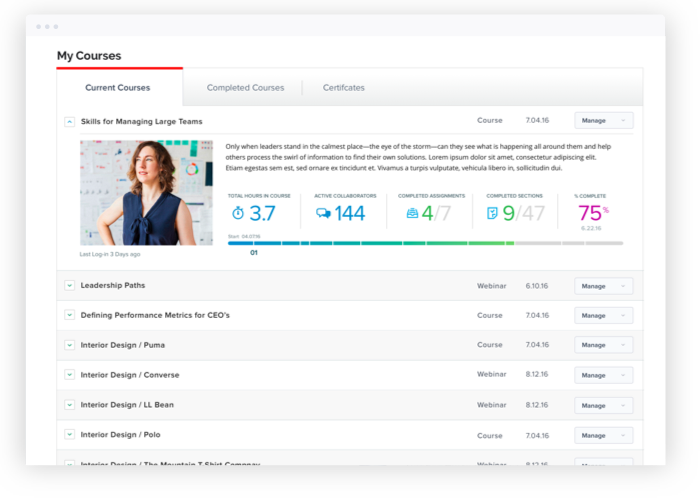
Provide learners with insight into their site usage with the Learner Dashboard. This shows them where they stand within their learning.
Bring your learner data into scope with your greater business by connecting to your Business Intelligence (BI) tool. This provides your raw learner data into a PostgreSQL database from which the data is pulled into your BI Tool.
